Skyscrapers and Stock Markets Are Telling Us Something – It’s Not Good
Skyscraper Museum founder Carol Willis may have found the best market indicator of the last century – tall buildings.
In her book, Form Follows Finance: Skyscrapers and Skylines in New York and Chicago, Willis clearly states, “the tallest buildings generally appear before the end of a boom, their height driven up by the speculative fever that affects both developers and lenders.”
Tall buildings cost a lot of money to build, and what’s a better time to build than when money is cheap?
That’s the exact situation we are in today. Money can be borrowed cheaply, which enables people to buy and spend lavishly. Except there is always a price to pay, even if it comes later.
It may seem a bit silly to say that market peaks correlate with the construction of tall buildings, but let’s take a look back in history…
The Singer Building and Met Life Building in New York = Panic of 1908
The Chrysler Building and Empire State Building = Stock Market Crash of 1929
WTC (Twin Towers) and Sears Building = Stock Market Crash and Oil Crisis of 1973
The Petronas Twin Towers (in Asia) = Asia Market Crash of 1997
The Burj Khalifa = Economic Crisis of 2008
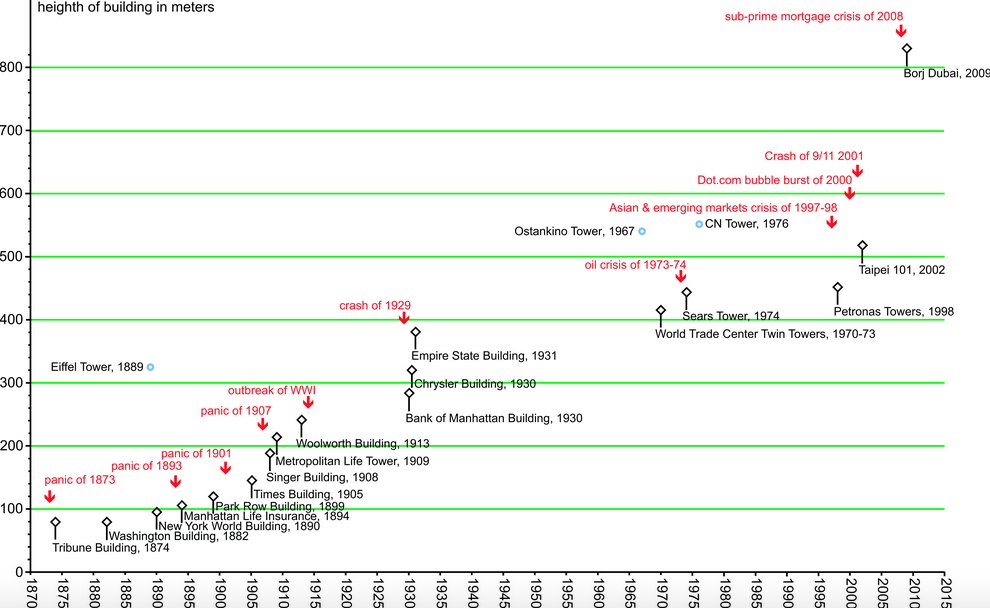
Source: Presenting the skyscraper index of stock market crashes. By Eric Ross
The exact completion date of these buildings and the exact dates of each market crash don’t fall on the exact same dates… but they’re pretty close.
And guess what happened last month? Construction on the world’s tallest building started.
“The Tower,” which will just surpass the current record holder (Burj Khalifa) is currently being built just down the road.
But, it’s not alone. Over in Saudi Arabia, the Jeddah Tower is going to be even bigger. It will be the first building to reach over a kilometer high. And it’s been under construction since 2013.
As interesting as this all is, there is an even better indicator for a market correction that happened yesterday.
All major indices in the United States reached all-time highs, on the same day. This hasn’t happened since the height of the dotcom boom of 1999.
Finally, let’s look at total market cap compared to GDP. This is Warren Buffett’s favorite market indicator. Basically, this metric compares how much money companies are making compared to how much money people are investing in stocks.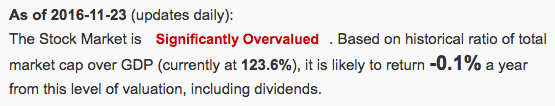
Source: gurufocus (a great resource I use daily)
If companies are making lots of money, but nobody is buying stocks, then the market is undervalued.
If companies are not making money, but people are spending lots of money to buy stocks, then the market is overvalued. This is the current situation we are in.
Taking a broader look at everything I just laid out, it may look like a bunch of fear-mongering.
But, it’s just the reality.
There is far too much risk in the market for not much reward.
However, this doesn’t mean we can’t still make money. We just can’t buy traditional stocks and expect them to magically grow. There could be massive downside with not much upside.
We’re going to have to use other methods to profit from this risky situation we are in.
One of those methods is positioning ourselves from the fall of certain stocks. This is something that I will be covering over the next few weeks.
The other method is investing in areas that have nothing to do with the stock market at all. I’ve already covered many different areas that we can explore, but I’ll also be sharing several more soon.
The bottomline is that there are numerous signals that are shouting, “BE CAREFUL.” We can chose to listen, or ignore and pay the price. The choice is yours.